Measure today, save from the very first month
Implement an energy management system in your company and make significant savings on your bills.
Wattseeker is an EMS (Energy Management System) designed to provide real-time visibility on energy consumption.
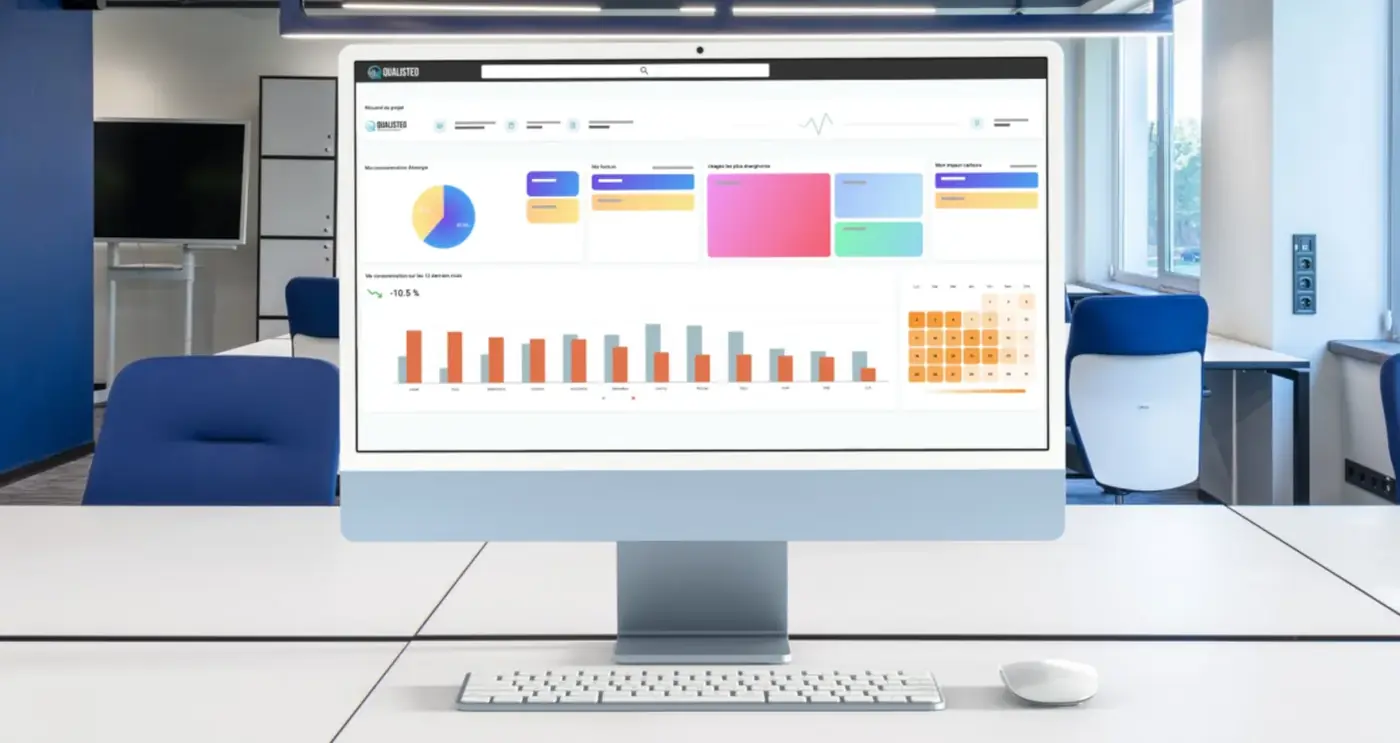
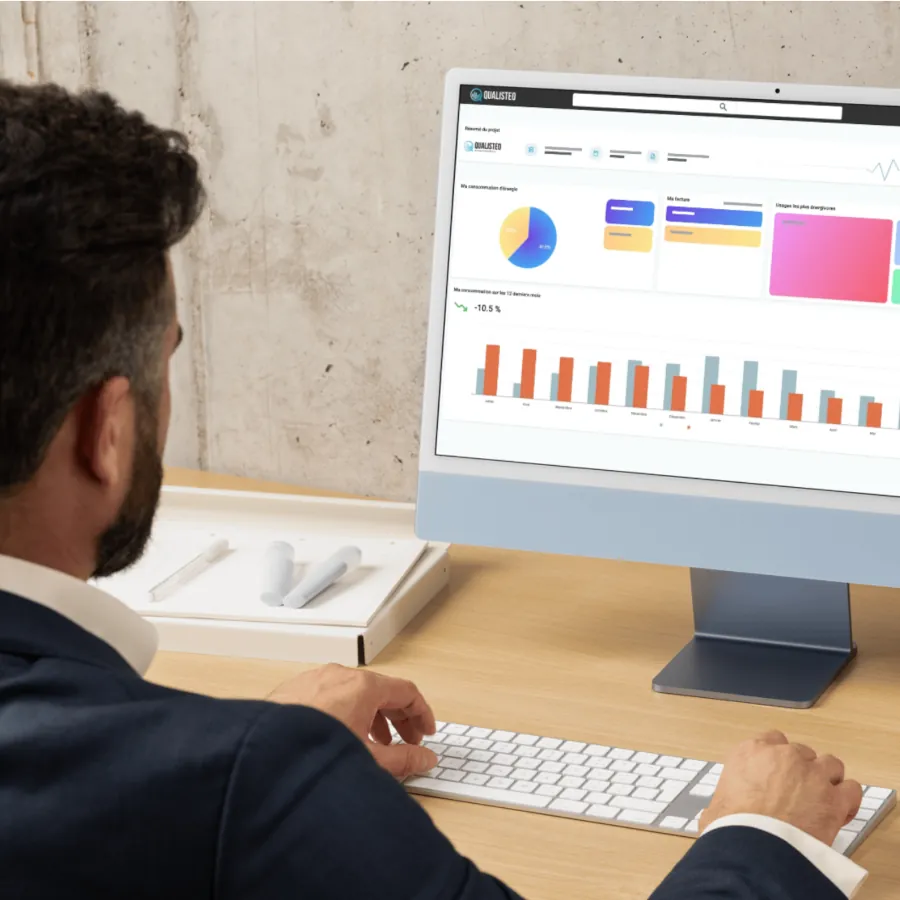
Wattseeker is the energy management platform designed to offer real-time visibility into the energy consumption of industrial, tertiary, or commercial sites. With an intuitive interface and advanced features, Wattseeker helps sites optimise their resource usage, reduce energy costs, and improve environmental performance.
You benefit from a precise visualization of your energy consumption data. Each metering point is monitored in real time, allowing you to quickly identify malfunctions and consumption deviations.
Stop wasting time searching for the source of your energy deviations. Be alerted when deviations in your energy performance indicators and consumption peaks occur on your site in order to take corrective action as quickly as possible.
With this analysis of your site energy data, you are able to act. Implementing more energy-efficient processes can allow you to make significant savings without impacting production.
The Wattseeker energy management software is the heart of your energy management system
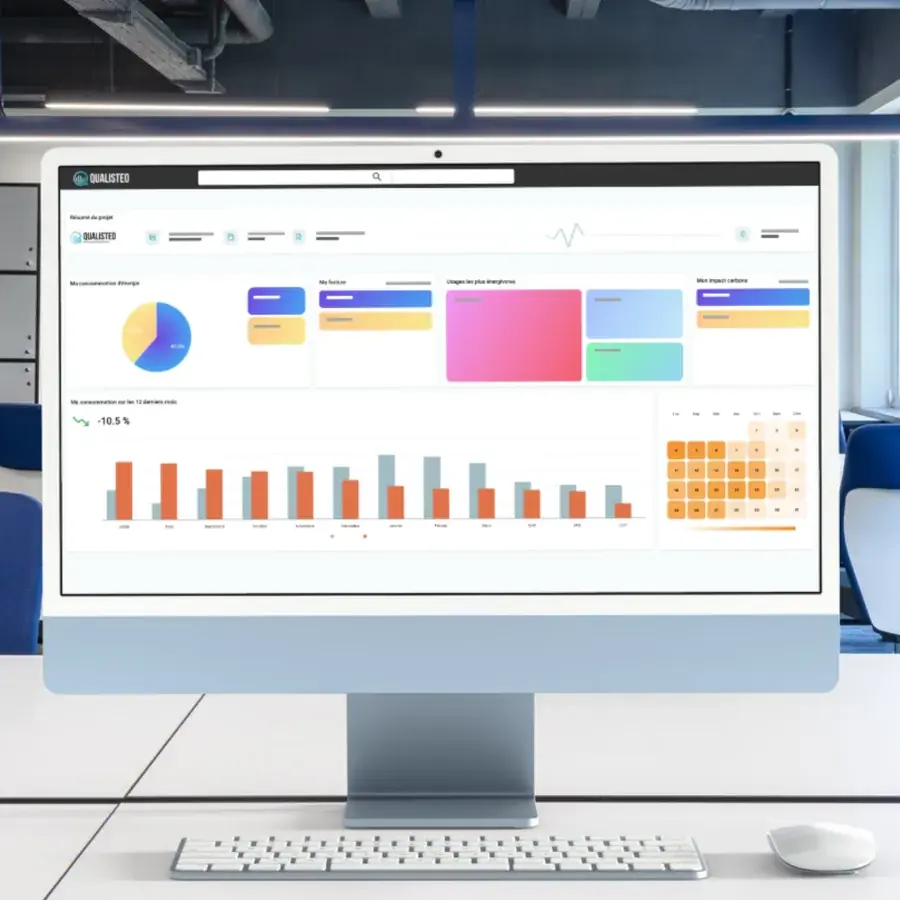
Book a demoWattseeker consolidates your energy data into customisable dashboards and detailed charts. You get a comprehensive overview of your consumption and can make informed decisions.
The Wattseeker platform simultaneously aggregates data for electricity, gas, water, steam, compressed air, and more. You benefit from an integrated and complete view of all your consumption sources.
Available data is immediately visible in the platform interface. You can therefore monitor your consumption in real time and see the impact of your changes live.
You are notified when thresholds are exceeded, allowing you to react immediately and avoid incidents.
Your reports are customised and their creation can be automated. You automatically have documents to track your energy performance, compare your consumption and identify trends.
By integrating historical data and consumption patterns, Wattseeker identifies optimisation areas and enables predictive maintenance to minimise interruptions.
The Wattseeker platform simultaneously aggregates data for electricity, gas, water, steam, compressed air, and more. You benefit from an integrated and complete view of all your consumption sources.
Available data is immediately visible in the platform interface. You can therefore monitor your consumption in real time and see the impact of your changes live.
You are notified when thresholds are exceeded, allowing you to react immediately and avoid incidents.
Your reports are customised and their creation can be automated. You automatically have documents to track your energy performance, compare your consumption and identify trends.
By integrating historical data and consumption patterns, Wattseeker identifies optimisation areas and enables predictive maintenance to minimise interruptions.
Our teams connect the management software to data from your sub-meter network or the sub-meters installed by Qualisteo and data available on your site.
The Wattseeker interface and its various dashboards are customised according to your site's specificities and your needs.
Your teams receive their access and are supported in mastering the various features with personalized training provided by a Qualisteo Energy Manager.
Wattseeker is available in several tiers to match your needs and the size of your site.
Answer three quick questions and we'll suggest the most suitable tier.
Real-time sub-metering and baseline tracking.
Alarms, load profiles, weather correlation, monotones.
Custom EnPIs, drift detection, regressions.
Multi-factor correlation and ENS tracking.
Action plans, SEUs, document hub, certification.
Book a software demo and get a quote tailored to your setup and goals
Book a demo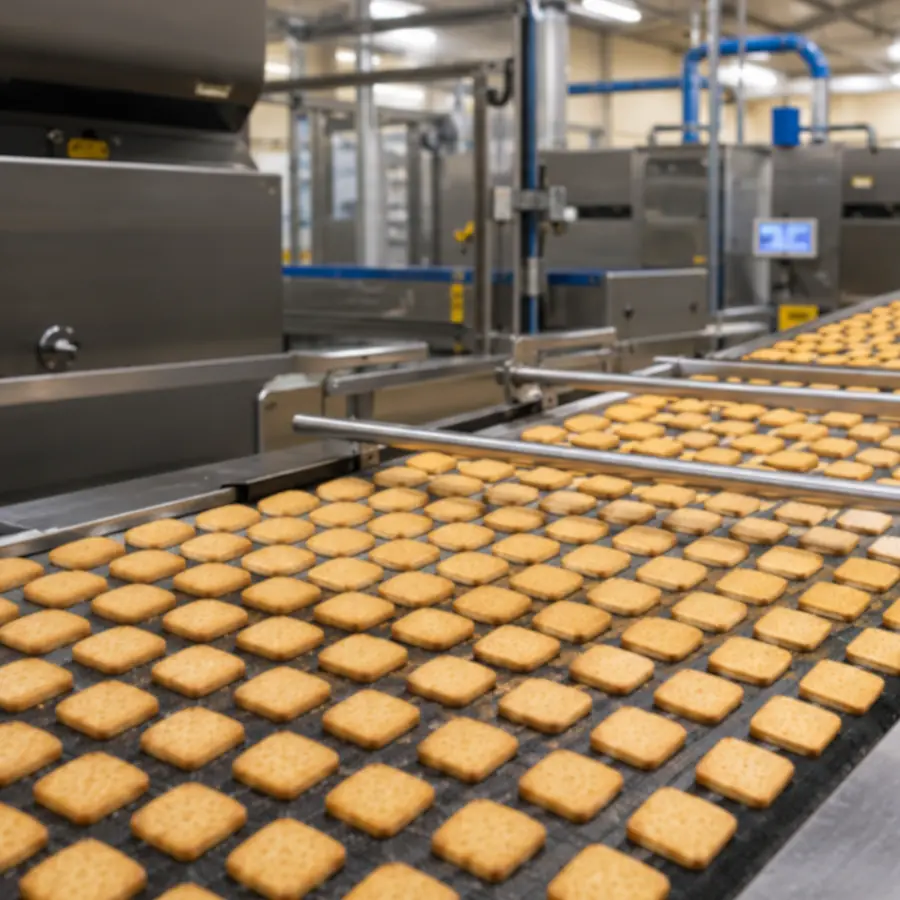
One of our clients, a food processing plant, implemented our energy management software.
The analyses revealed numerous unnecessary consumptions, particularly when production was idle. Compressors, the boiler, the refrigeration unit and lighting continued to consume at full capacity during nights and weekends. Operating drifts were also identified during production. For example, some equipment was not properly configured and generated unnecessary overconsumption. Some machines were always running at maximum capacity and did not take production volume into account.
New rules were therefore put in place by management to stop the waste. The reduction in energy consumption had no negative impact on product quality or hygiene.
The corrective measures reduced energy consumption by 22% in just 5 months.
All data aggregated by the Wattseeker platform can be downloaded in a single click in seconds.
Multi-site monitoring can be set up to compare and benchmark sites and processes.
Charts and indicators are fully customisable according to your needs and objectives.
Thanks to secure remote access, you can access your data from anywhere. This guarantees continuous monitoring, even remotely.
You can view consumption (by measured fluid) in kWh, euros (or your local currency) and CO₂.
Consumption and expenditure are displayed by:
Your action plan is digitalised and you can track savings achieved.
You can model the impact of your changes on influence parameters in real time. It is also possible to predict consumption based on influence parameters.
Visualise your specific consumption indicators and monitor the efficiency of production processes.
Data hosted on dedicated servers located in France.
Digitalise the energy performance review with dynamic monitoring of Significant Energy Uses (SEUs) and Energy Performance Indicators (EPIs). The software also provides an interface to track your objectives, your action plan, influence variables and achieved savings.

Track your CO₂ emissions and savings through the integration of your energy supply contracts.
You benefit from support and assistance from our teams during our opening hours.
The Wattseeker energy management software is designed and developed in France by Qualisteo.
Yes, as soon as the tool is set up, alert thresholds are fixed and an emergency contact list is created. As soon as these thresholds are reached or exceeded, a message is sent to these contacts.
The different views of the Wattseeker tool are personalised from the software delivery to match your industrial site's specificities as closely as possible. Thus, your workshops, production zones and main energy expenditure items will be clearly visible in the interface. Each user can personalise the Wattseeker platform by creating their own indicators, alarms and alerts, as well as reports to be edited directly on the platform.
Updates are included in the licence. As Wattseeker is a SaaS platform, you benefit from the latest version available every time you log in.
Yes, the Wattseeker energy management software is designed to integrate energy data of different kinds.
The dashboards and various screens seamlessly integrate the energy mix of your facility, regardless of the energy sources you use.
Cost and carbon footprint calculations take into account the specifics of your energy mix.
Yes, the Wattseeker platform can aggregate data from many sites located around the world.
In addition, you can configure the access level for each user to distinguish those with a full global view, those with country-level access and those who can only see the data for one specific site.
The most complex projects even involve several hundred sites. One of our customers uses Wattseeker to monitor the energy consumption of more than 400 facilities located on every continent. Headquarters can thus track the group's energy consumption and carbon impact worldwide in a single interface, while each site can analyse its own energy consumption.
Wattseeker does not replace regulatory energy audits; it automates data collection and therefore greatly simplifies audits and certifications.
The main benefit of Wattseeker is that it automatically collects, centralises and organises energy consumption data. This data can be easily exported. No more manual meter readings.
For ISO 50001 compliance, the evolution of Significant Energy Uses (SEU) is monitored automatically and has its own dedicated dashboard. Tracking of your improvement actions is also automated through a dedicated report.
For companies with several sites looking to automate their group-level energy reporting, all energy data is available in a single interface and can be easily exported.
Yes, Wattseeker is designed to work with all existing measurement technologies, and therefore works with sub-meters other than those produced by Qualisteo.
The main protocols used in the industrial sector (Modbus, BACnet, OPC-UA, M-Bus, LoRaWAN) are supported.
Yes, CO2 emissions are tracked and have their own dedicated tab. You can consult the history of your CO2 emissions on a daily or monthly basis.
To give you maximum understanding of your CO2 emissions, the data can be observed at several levels: at the use, site or country level.
Energy modelling algorithms allow you to anticipate the impact of certain changes on your energy consumption. These AI algorithms are trained on your data history and therefore deliver results specific to your activity.
Production volume changes are among the variables you can model.
Choose to simulate an increase or decrease in activity on one or more production lines and observe the impact on your energy consumption.
Energy consumption is visible at the sub-metering point, use, area or building level.
This allows you to easily identify the impact of a process or piece of equipment on your energy consumption.
You can precisely identify the source of a consumption peak, but also of a drop.
Yes, in two ways.
First, specific screens with AI algorithms allow you to observe the impact of produced quantities on your site's energy consumption, at the use level. You obtain statistical correlations between your production data and your energy consumption.
Second, Wattseeker uses a standardised calculation method to determine whether your energy consumption is rising or falling: the IPMVP protocol. This method takes into account variables such as weather or your activity level to calculate the energy savings you achieve.